To complete this assignment you will need to know how to use Excel to create graphs.
Your first step is enter your data. Excel is pretty clever to try and guess how you want your data into a graph, but there are some tips to help make sure it works correctly.
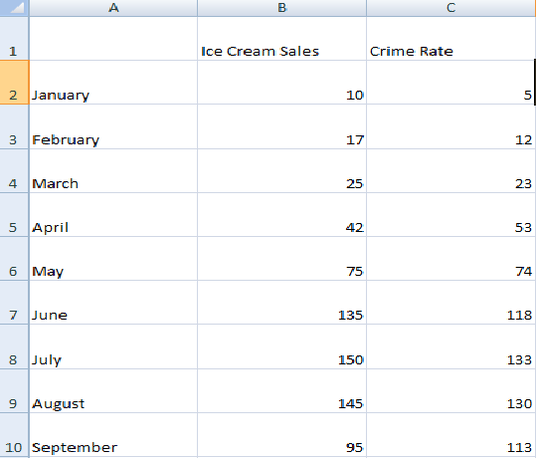
(1) Only put one piece of data into a cell.
(2) Keep all your data in order.
(3) Include labels and titles.
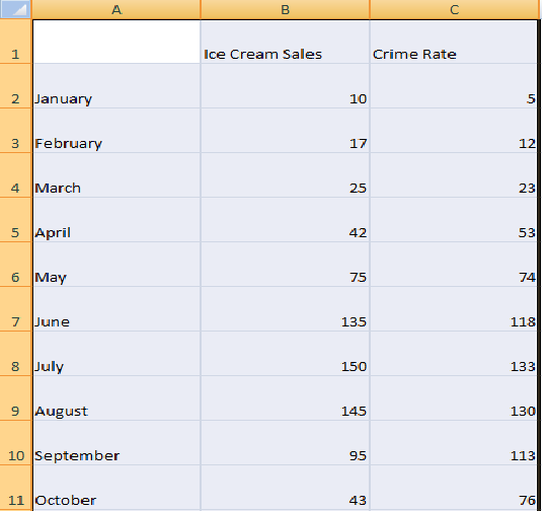
Your next step is to select the data you want to graph. This is done by clicking and dragging over the cells you want to include in the graph.
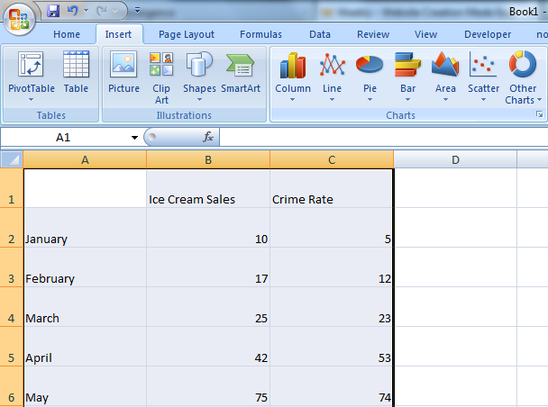
Next click on the "insert" tab. This menu will allow you to chose what type of graph you want to use for your selected data.
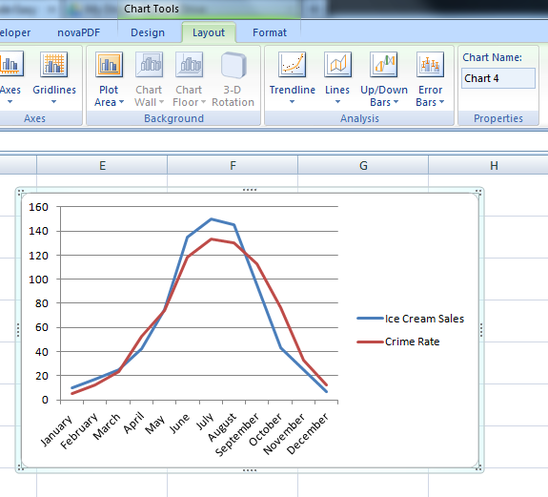
Your last step is to use the "design", "layout" and "format" tabs to title and label your chart. Every axis, item and the chart itself should have a label or a title.
