The human mind is pretty awful at taking a lot of words and getting a
complex meaning from them.
Most people can do this much easier if they have something to look at.
For example the words and the graph pretty much say the same thing.
complex meaning from them.
Most people can do this much easier if they have something to look at.
For example the words and the graph pretty much say the same thing.
|
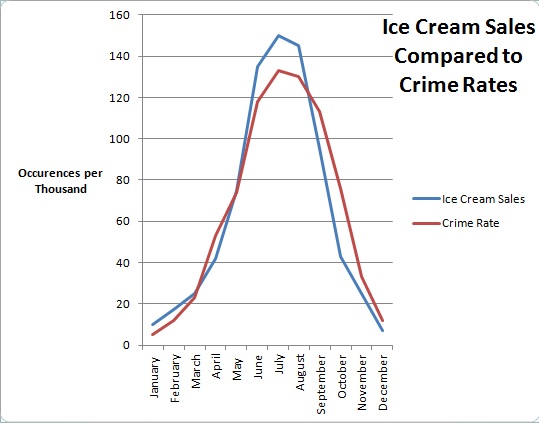
The general trend in the statistical analysis of ice cream sales compared to crime rates is a positive increasing corollary relationship until the median data point and a positive decreasing corollary relationship until the end of the data. The data shows a minimal frequency of 5 and a maximum frequency of 145. The crossover between data occurs in a tertiary intersect, twice on the approach and once on the decline. The average gap between data streams is approximated at a value of 6. |
|
We use graphs and images to help our minds gain an understanding of what we need to know. Without these images, it can be very difficult to realize what is happening. This is why we use graphing in mathematics.
